
Options trading involves multiple variables that can make it difficult to understand how a strategy may behave at different underlying asset prices.
An options payoff calculator can make this easier by converting a strategy into a visual profit-and-loss diagram. Instead of evaluating each option leg separately, traders and learners can see how a complete strategy may behave at expiration.
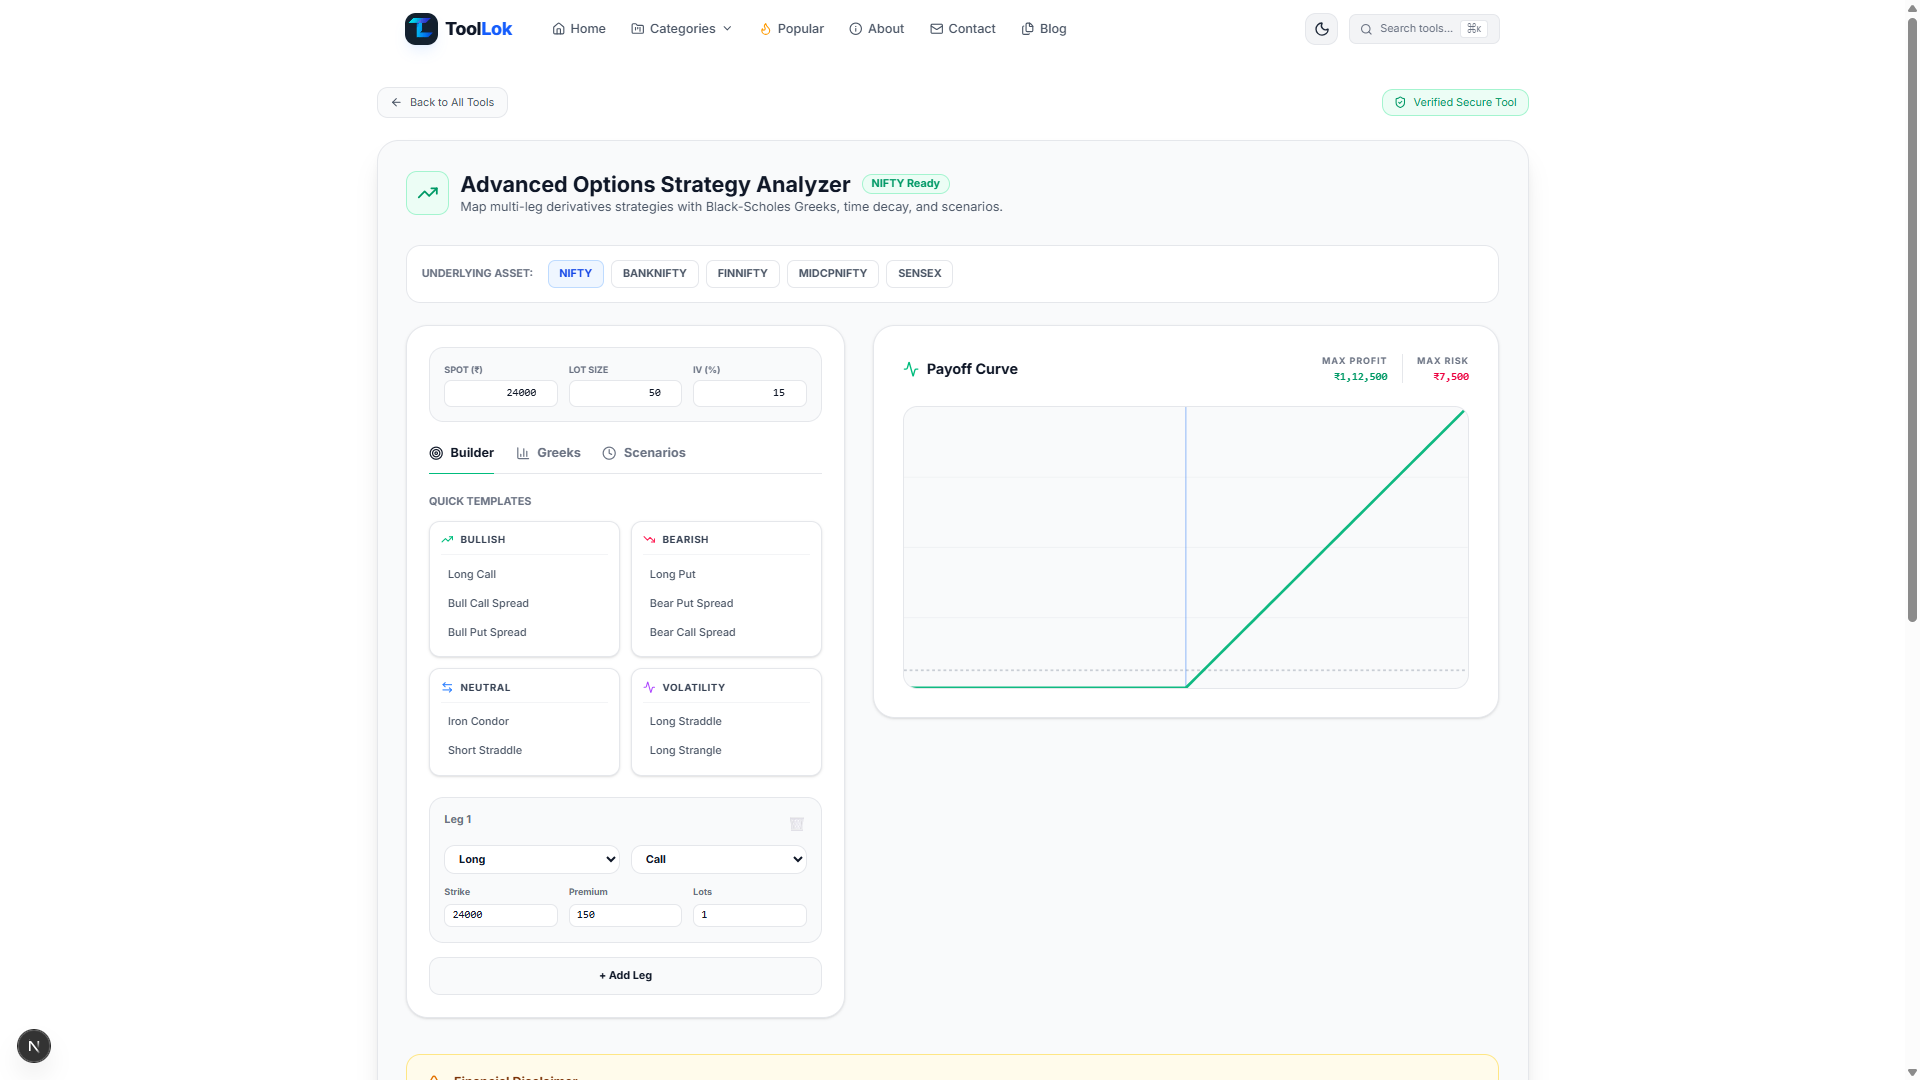
ToolLok's Options & Derivatives Payoff Visualizer allows you to build multi-leg options strategies, enter the underlying spot price, strike price, premium, and lot size, and visualize the resulting payoff profile.
The tool also provides information related to maximum profit, maximum risk, portfolio Delta, portfolio Theta, and other strategy metrics.
⚠️ Important Financial Disclaimer
This article and the ToolLok calculator are provided for educational, informational, and analytical purposes only. They are not financial, investment, or trading advice.
Options and derivatives can involve substantial risk, including the possibility of losing the entire amount invested or more depending on the strategy and market conditions.
Always understand the risks, contract specifications, fees, margin requirements, and market conditions before making any financial decision.
📈 Visualize an Options Strategy
Build a multi-leg options strategy and instantly explore its potential payoff profile with ToolLok.
What Is an Options Payoff Calculator?
An options payoff calculator is a tool that helps estimate how an options position may perform at different underlying asset prices.
The calculator generally considers information such as the option type, strike price, premium, position direction, quantity, and underlying asset price.
The resulting calculations can then be displayed as a payoff diagram showing potential profit and loss across different prices.
This is especially useful when analyzing strategies containing multiple options legs.
What Is an Options Payoff Diagram?
An options payoff diagram is a graphical representation of how a strategy's profit or loss changes as the underlying asset price changes.
The horizontal axis normally represents the underlying asset price, while the vertical axis represents the strategy's potential profit or loss.
A simplified payoff relationship for a long call option at expiration can be represented as:
Call Payoff = max(Spot Price - Strike Price, 0)

Profit = Call Payoff - Premium Paid
This simplified formula describes the expiration payoff of a long call before considering transaction costs and other real-world factors.
Call Options vs Put Options
The two basic types of options are calls and puts.
Call Option
A call option gives the holder the right, but generally not the obligation, to buy an underlying asset at a specified strike price according to the contract terms.
For a long call, the expiration payoff increases as the underlying price moves above the strike price, subject to the premium paid and other costs.
Put Option
A put option gives the holder the right, but generally not the obligation, to sell an underlying asset at a specified strike price according to the contract terms.
For a long put, the expiration payoff generally increases as the underlying price moves below the strike price, subject to the premium paid and other costs.
Long vs Short Options Positions
Options strategies can become more complex when you combine long and short positions.
| Position | Basic Concept | Typical Payoff Behavior |
|---|---|---|
| Long Call | Buy a call option | Benefits from sufficient upside movement |
| Short Call | Sell a call option | Generally benefits when the option expires below the strike |
| Long Put | Buy a put option | Benefits from sufficient downside movement |
| Short Put | Sell a put option | Generally benefits when the option expires above the strike |
Actual outcomes depend on contract specifications, premium, settlement rules, fees, margin, volatility, and other factors.
What Is a Multi-Leg Options Strategy?
A multi-leg options strategy combines two or more option positions into a single strategy.
Instead of evaluating every option separately, a payoff visualizer combines the individual legs into one portfolio payoff profile.
Examples of multi-leg strategies include:
- Vertical spreads
- Call spreads
- Put spreads
- Straddles
- Strangles
- Butterflies
- Iron condors
- Calendar spreads
- Other custom multi-leg structures
The exact risk profile depends on the strikes, premiums, quantities, expiration dates, underlying price, and other contract details.
How ToolLok's Options Payoff Visualizer Works
ToolLok's Options & Derivatives Payoff Visualizer is designed to make multi-leg strategy analysis easier through an interactive strategy builder and payoff chart.
The interface shown in the tool includes inputs for:
- Spot price
- Lot size
- Implied volatility (IV)
- Strategy legs
- Long or short position
- Call or put option
- Strike price
- Premium
- Number of lots
After the strategy is configured, the visualizer displays a payoff chart together with strategy-level information.
Understanding the Spot Price
The spot price represents the current price of the underlying asset used in the strategy analysis.
For example, if you are analyzing an option strategy on an underlying currently trading around ₹24,000, the spot price input can be set accordingly.
The spot price provides a reference point for understanding where the current market price sits relative to the selected strikes.
Understanding Strike Price
The strike price is the price specified in an options contract at which the underlying can be bought or sold according to the option's terms.
Strike price is one of the most important inputs when creating an options payoff diagram because it determines where the payoff characteristics of the option change.
Understanding Option Premium
The premium is the amount paid by the buyer of an option to the seller for the option contract.
Premium can have a significant impact on the final profit or loss of an options strategy.
For a long option, the premium is generally an initial cost. For a short option, the premium is generally received initially, although the position carries its own risks.
Understanding Lot Size and Quantity
Options contracts commonly represent a specified quantity of the underlying asset.
The lot size determines how many units are represented by one contract or lot according to the relevant contract specifications.
Changing the lot size or number of lots can significantly change the monetary value of the strategy's profit and loss.
Always verify the current contract specifications for the specific market and instrument you are analyzing.
How to Add Strategy Legs
The strategy builder allows you to construct a multi-leg position by adding individual option legs.
Each leg can contain important parameters such as:
- Long or Short direction
- Call or Put option type
- Strike price
- Premium
- Number of lots
By combining these legs, you can create a custom payoff structure and visualize the combined result.
Example: Building a Simple Call Strategy
Suppose you want to analyze a fictional long call position.
You could start with example inputs such as:
Spot Price: 24000
Strike Price: 24000
Premium: 150
Lots: 1
Position: Long
Option Type: Call
These values are purely illustrative and are not a trading recommendation.
The payoff visualization can then show how the strategy's expiration profit or loss changes across different underlying prices.
What Does Maximum Profit Mean?
Maximum profit represents the highest calculated profit within the payoff scenario being evaluated.
Whether maximum profit is mathematically limited or theoretically unlimited depends on the structure of the strategy.
For example, some option structures have a defined maximum profit, while other structures can have profit that continues increasing as the underlying moves in a favorable direction.
What Does Maximum Risk Mean?
Maximum risk refers to the greatest loss represented by the strategy under the modeled conditions.
Some strategies have clearly defined maximum losses, while other positions can have substantially larger or theoretically unlimited exposure depending on the position structure.
Users should always understand the complete risk profile of a strategy rather than focusing only on its potential maximum profit.
What Are Option Greeks?
Option Greeks are mathematical measures used to describe how an option's value may respond to changes in different variables.
Common Greeks include Delta, Gamma, Theta, and Vega.
Delta
Delta measures the sensitivity of an option's price to a change in the underlying asset price, under the assumptions of the pricing model being used.
Gamma
Gamma describes the rate of change of Delta as the underlying asset price changes.
Theta
Theta is commonly associated with the sensitivity of an option's value to the passage of time, holding other modeled variables constant.
Vega
Vega describes sensitivity to changes in implied volatility.
Greeks are model-based measures and should not be interpreted as guaranteed predictions of future market behavior.
What Is Portfolio Delta?
When a strategy contains multiple options, each leg can contribute to the overall Delta of the position.
Portfolio Delta represents the combined Delta exposure of the strategy under the assumptions of the pricing model.
The ToolLok visualizer displays portfolio Delta as part of its strategy-level analysis.
What Is Portfolio Theta?
Portfolio Theta combines the time-sensitivity contributions of the individual option positions.
A strategy with multiple option legs can therefore have a different overall Theta from any single option in the position.
The ToolLok visualizer displays portfolio Theta to help users inspect the modeled time sensitivity of the combined strategy.
What Is Implied Volatility?
Implied volatility (IV) is a market-derived measure associated with the volatility input implied by an option's market price under a particular pricing model.
Higher implied volatility can affect option values and therefore influence strategy pricing and Greeks.
The ToolLok tool includes an IV input as part of its derivatives strategy analysis.
Black-Scholes Model Explained
The Black-Scholes model is a well-known mathematical framework for estimating the theoretical value of certain European options under specified assumptions.
A simplified representation of the model's inputs includes:
- Underlying asset price
- Strike price
- Time to expiration
- Volatility
- Risk-free interest rate
The model has important assumptions and limitations. Real-world markets may differ from those assumptions due to transaction costs, liquidity, volatility changes, early exercise features, dividends, discrete market movements, and other factors.
Why Use an Options Payoff Visualizer?
An interactive payoff chart can make complex options strategies easier to understand than looking at individual formulas alone.
Some useful applications include:
- Learning how option strategies behave
- Visualizing expiration profit and loss
- Comparing different strategy structures
- Understanding strike-price relationships
- Studying multi-leg strategies
- Exploring option Greeks
- Understanding theoretical risk and reward
- Testing hypothetical scenarios
How to Use ToolLok's Options & Derivatives Payoff Visualizer
- Enter the spot price. Enter the current or hypothetical price of the underlying asset.
- Enter the lot size. Specify the applicable contract quantity for your analysis.
- Enter implied volatility. Provide the IV assumption required for the model-based calculations.
- Add a strategy leg. Select whether the position is Long or Short and choose Call or Put.
- Enter the strike price. Add the strike associated with the option leg.
- Enter the premium. Add the premium paid or received for the option leg.
- Enter the number of lots. Specify the quantity used in the strategy.
- Add additional legs if required. Build a multi-leg strategy by adding more option positions.
- Review the payoff chart. Examine how the modeled profit and loss changes across underlying prices.
- Review the strategy metrics. Inspect maximum profit, maximum risk, portfolio Delta, and portfolio Theta.
📊 Build Your Options Strategy
Enter hypothetical strategy inputs and visualize the modeled payoff profile using ToolLok's interactive calculator.
Example of a Multi-Leg Strategy
A multi-leg strategy can be represented using several option positions with different strikes and premiums.
For example, a hypothetical strategy could contain:
Leg 1:
Position: Long
Type: Call
Strike: 24000
Premium: 150
Lots: 1

Leg 2:
Position: Short
Type: Call
Strike: 24500
Premium: 80
Lots: 1
This is a simplified educational example. Actual strategy analysis should use the correct contract specifications, premiums, expiration dates, quantities, and market data for the instrument being studied.
Why Visualizing Multiple Legs Matters
Looking at each option independently can make a multi-leg strategy difficult to understand.
A combined payoff diagram shows how the individual positions interact with one another.
This can make it easier to identify areas where the combined strategy may have positive or negative modeled payoff at expiration.
Payoff at Expiration vs Real-Time Option Value
One important distinction is the difference between an expiration payoff diagram and the actual market value of an option before expiration.
At expiration, intrinsic payoff becomes a major component of the final result. Before expiration, an option's market value can also reflect time value, implied volatility, interest rates, dividends, liquidity, and other factors.
Therefore, an expiration payoff graph should not be interpreted as a guaranteed prediction of the option's market price before expiration.
Common Mistakes When Analyzing Options Strategies
1. Ignoring Premium
Looking only at strike prices without considering premiums can give an incomplete picture of the strategy's profit and loss.
2. Forgetting Contract Quantity
A payoff that appears small on a per-unit basis can represent a substantially different monetary amount when multiplied by the applicable contract quantity.
3. Confusing Payoff With Profit
Option payoff and actual profit are not always the same because premiums and transaction costs can affect the final result.
4. Ignoring Volatility
Implied volatility can significantly influence option pricing and Greeks before expiration.
5. Focusing Only on Maximum Profit
A strategy should be evaluated by its complete risk profile rather than focusing only on its potential maximum reward.
6. Using Incorrect Contract Specifications
Lot sizes, expiration rules, settlement methods, and other contract specifications can differ between markets and instruments.
Options Strategy Analysis Checklist
- Check the underlying spot price.
- Verify the contract lot size.
- Check the expiration date.
- Enter the correct strike prices.
- Enter the relevant premiums.
- Verify whether each leg is Long or Short.
- Verify whether each leg is a Call or Put.
- Review maximum modeled profit.
- Review maximum modeled risk.
- Review the payoff chart.
- Consider volatility assumptions.
- Understand the Greeks and their limitations.
- Consider transaction costs and other real-world factors.
Who Can Use an Options Payoff Calculator?
An options payoff visualizer can be useful for several groups, including:
- Options trading students
- Finance students
- Developers building financial applications
- Quantitative finance learners
- Derivatives researchers
- Traders studying hypothetical strategies
- Educators explaining options concepts
- Anyone learning options payoff diagrams
Frequently Asked Questions
What is an options payoff calculator?
An options payoff calculator estimates the potential profit or loss of an options position across different underlying asset prices. It can be particularly useful for understanding multi-leg strategies.
What is an options payoff diagram?
An options payoff diagram is a graph showing how a strategy's modeled profit or loss changes as the underlying asset price changes.
Can I calculate multi-leg options strategies?
Yes. ToolLok's Options & Derivatives Payoff Visualizer is designed to let you add multiple strategy legs and view their combined payoff profile.
What are option Greeks?
Option Greeks are sensitivity measures used to describe how an option or options portfolio may respond to changes in variables such as the underlying price, time, and implied volatility.
What is Delta in options?
Delta is a model-based sensitivity measure that describes how an option's value may change in response to a change in the underlying asset price, holding other modeled variables constant.
What is Theta in options?
Theta is commonly used to describe the sensitivity of an option's value to the passage of time, under the assumptions of the pricing model.
What is implied volatility?
Implied volatility is a market-derived volatility measure associated with an option's market price under a particular pricing model.
What is the Black-Scholes model?
Black-Scholes is a mathematical option-pricing model commonly used for certain European-style options under specified assumptions.
Does an options payoff calculator predict future profit?
No. A payoff calculator models the outcome based on the inputs and assumptions provided. Actual market outcomes can differ because of changing prices, volatility, liquidity, transaction costs, contract specifications, and other factors.
Is this options calculator financial advice?
No. ToolLok's calculator is intended for educational and analytical purposes. It should not be treated as personalized financial or investment advice.
Conclusion
Understanding options strategies becomes easier when the individual components can be viewed together in a single payoff diagram.
An options payoff calculator can help visualize how changes in the underlying price may affect a strategy at expiration.
ToolLok's Options & Derivatives Payoff Visualizer allows you to build multi-leg strategies using spot price, lot size, implied volatility, strike price, premium, and position information.
The tool also provides strategy-level metrics such as modeled maximum profit, maximum risk, portfolio Delta, and portfolio Theta.
Use the calculator with hypothetical inputs to learn how different options structures behave and to better understand concepts such as payoff diagrams, option Greeks, implied volatility, and the Black-Scholes framework.
📈 Explore the Options Payoff Calculator
Build a hypothetical multi-leg derivatives strategy and visualize its modeled payoff profile with ToolLok.